1920 United States presidential election in Pennsylvania
1920 United States presidential election in Pennsylvania
(Redirected from United States presidential election in Pennsylvania, 1920)
Jump to navigation
Jump to search
| ||||||||||||||||||||||||||
| ||||||||||||||||||||||||||
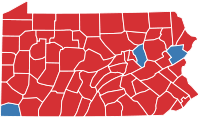
 County results | ||||||||||||||||||||||||||
| ||||||||||||||||||||||||||
| Elections in Pennsylvania | ||||||||||||||
|---|---|---|---|---|---|---|---|---|---|---|---|---|---|---|
 | ||||||||||||||
Federal government
| ||||||||||||||
State government
| ||||||||||||||
Elections by year
| ||||||||||||||
Philadelphia
| ||||||||||||||
Pittsburgh
| ||||||||||||||
Lancaster
| ||||||||||||||
Allentown
| ||||||||||||||
Harrisburg
| ||||||||||||||
The 1920 United States presidential election in Pennsylvania took place on November 2, 1920. Voters chose 38 representatives, or electors to the Electoral College, who voted for president and vice president.
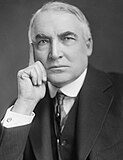
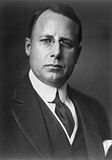
Pennsylvania overwhelmingly voted for the Republican nominee, Senator Warren G. Harding, over the Democratic nominee, Ohio Governor James M. Cox. Harding won Pennsylvania by a landslide margin of 38.56 percent.
Results[edit]
| United States presidential election in Pennsylvania, 1920[1] | |||||
|---|---|---|---|---|---|
| Party | Candidate | Votes | Percentage | Electoral votes | |
Republican | Warren G. Harding | 1,218,216 | 65.76% | 38 | |
Democratic | James M. Cox | 503,843 | 27.20% | 0 | |
Socialist | Eugene Debs | 70,571 | 3.81% | 0 | |
Prohibition | Aaron Watkins | 42,696 | 2.30% | 0 | |
Farmer-Labor | Parley P. Christensen | 15,704 | 0.85% | 0 | |
| Single Tax | Robert Macauley | 806 | 0.04% | 0 | |
Socialist Labor | William Wesley Cox | 753 | 0.04% | 0 | |
| Write-ins | Write-ins | 27 | 0.00% | 0 | |
Totals | 1,852,616 | 100.00% | 38 | ||
Results by county[edit]
| Warren Gamaliel Harding Republican | James Middleton Cox Democratic | Eugene Victor Debs Socialist | Aaron Sherman Watkins Prohibition | Parley Parker Christensen Farmer-Labor | Various candidates Other parties | Margin | Total votes cast[2] | ||||||||
|---|---|---|---|---|---|---|---|---|---|---|---|---|---|---|---|
| County | # | % | # | % | # | % | # | % | # | % | # | % | # | % | # |
Adams | 5,323 | 56.94% | 3,852 | 41.20% | 85 | 0.91% | 81 | 0.87% | 6 | 0.06% | 2 | 0.02% | 1,471 | 15.73% | 9,349 |
Allegheny | 138,908 | 69.21% | 40,278 | 20.07% | 16,262 | 8.10% | 3,670 | 1.83% | 1,312 | 0.65% | 286 | 0.14% | 98,630 | 49.14% | 200,716 |
Armstrong | 8,995 | 69.23% | 3,262 | 25.11% | 220 | 1.69% | 427 | 3.29% | 84 | 0.65% | 4 | 0.03% | 5,733 | 44.13% | 12,992 |
Beaver | 11,691 | 62.90% | 4,771 | 25.67% | 1,164 | 6.26% | 816 | 4.39% | 101 | 0.54% | 43 | 0.23% | 6,920 | 37.23% | 18,586 |
Bedford | 5,800 | 61.67% | 2,594 | 27.58% | 80 | 0.85% | 189 | 2.01% | 736 | 7.83% | 6 | 0.06% | 3,206 | 34.09% | 9,405 |
Berks | 22,221 | 47.69% | 18,361 | 39.41% | 5,674 | 12.18% | 288 | 0.62% | 24 | 0.05% | 23 | 0.05% | 3,860 | 8.28% | 46,591 |
Blair | 15,035 | 56.97% | 5,668 | 21.48% | 389 | 1.47% | 582 | 2.21% | 4,671 | 17.70% | 47 | 0.18% | 9,367 | 35.49% | 26,392 |
Bradford | 11,947 | 75.14% | 2,825 | 17.77% | 161 | 1.01% | 943 | 5.93% | 19 | 0.12% | 5 | 0.03% | 9,122 | 57.37% | 15,900 |
Bucks | 14,130 | 65.17% | 6,867 | 31.67% | 405 | 1.87% | 224 | 1.03% | 42 | 0.19% | 13 | 0.06% | 7,263 | 33.50% | 21,681 |
Butler | 10,467 | 66.87% | 3,829 | 24.46% | 214 | 1.37% | 1,103 | 7.05% | 25 | 0.16% | 15 | 0.10% | 6,638 | 42.41% | 15,653 |
Cambria | 19,629 | 63.91% | 6,961 | 22.67% | 834 | 2.72% | 635 | 2.07% | 2,603 | 8.48% | 50 | 0.16% | 12,668 | 41.25% | 30,712 |
Cameron | 1,364 | 68.06% | 497 | 24.80% | 9 | 0.45% | 130 | 6.49% | 3 | 0.15% | 1 | 0.05% | 867 | 43.26% | 2,004 |
Carbon | 7,900 | 59.19% | 5,030 | 37.69% | 281 | 2.11% | 86 | 0.64% | 40 | 0.30% | 9 | 0.07% | 2,870 | 21.50% | 13,346 |
Centre | 7,615 | 57.82% | 4,783 | 36.31% | 84 | 0.64% | 569 | 4.32% | 115 | 0.87% | 5 | 0.04% | 2,832 | 21.50% | 13,171 |
Chester | 18,129 | 69.57% | 7,004 | 26.88% | 277 | 1.06% | 599 | 2.30% | 37 | 0.14% | 14 | 0.05% | 11,125 | 42.69% | 26,060 |
Clarion | 4,615 | 53.28% | 3,487 | 40.26% | 126 | 1.45% | 406 | 4.69% | 22 | 0.25% | 6 | 0.07% | 1,128 | 13.02% | 8,662 |
Clearfield | 9,615 | 52.28% | 5,987 | 32.55% | 657 | 3.57% | 1,163 | 6.32% | 948 | 5.15% | 23 | 0.13% | 3,628 | 19.72% | 18,393 |
Clinton | 4,303 | 54.58% | 2,976 | 37.75% | 259 | 3.29% | 228 | 2.89% | 111 | 1.41% | 7 | 0.09% | 1,327 | 16.83% | 7,884 |
Columbia | 6,238 | 45.65% | 6,965 | 50.97% | 81 | 0.59% | 363 | 2.66% | 14 | 0.10% | 4 | 0.03% | -727 | -5.32% | 13,665 |
Crawford | 10,032 | 62.31% | 4,175 | 25.93% | 423 | 2.63% | 1,419 | 8.81% | 33 | 0.20% | 17 | 0.11% | 5,857 | 36.38% | 16,099 |
Cumberland | 8,579 | 54.73% | 6,455 | 41.18% | 92 | 0.59% | 476 | 3.04% | 68 | 0.43% | 4 | 0.03% | 2,124 | 13.55% | 15,674 |
Dauphin | 26,094 | 65.36% | 11,990 | 30.03% | 628 | 1.57% | 776 | 1.94% | 419 | 1.05% | 16 | 0.04% | 14,104 | 35.33% | 39,923 |
Delaware | 34,126 | 75.34% | 9,602 | 21.20% | 697 | 1.54% | 670 | 1.48% | 153 | 0.34% | 45 | 0.10% | 24,524 | 54.15% | 45,293 |
Elk | 5,267 | 66.14% | 2,093 | 26.28% | 178 | 2.24% | 390 | 4.90% | 30 | 0.38% | 6 | 0.08% | 3,174 | 39.85% | 7,964 |
Erie | 19,465 | 63.68% | 6,311 | 20.65% | 1,833 | 6.00% | 2,801 | 9.16% | 87 | 0.28% | 72 | 0.24% | 13,154 | 43.03% | 30,569 |
Fayette | 20,186 | 56.68% | 13,358 | 37.51% | 1,204 | 3.38% | 770 | 2.16% | 81 | 0.23% | 12 | 0.03% | 6,828 | 19.17% | 35,611 |
Forest | 993 | 56.36% | 389 | 22.08% | 58 | 3.29% | 320 | 18.16% | 2 | 0.11% | 0 | 0.00% | 604 | 34.28% | 1,762 |
Franklin | 8,376 | 60.45% | 5,020 | 36.23% | 177 | 1.28% | 246 | 1.78% | 33 | 0.24% | 5 | 0.04% | 3,356 | 24.22% | 13,857 |
Fulton | 1,292 | 50.19% | 1,231 | 47.82% | 11 | 0.43% | 24 | 0.93% | 13 | 0.51% | 3 | 0.12% | 61 | 2.37% | 2,574 |
Greene | 4,253 | 42.41% | 5,592 | 55.76% | 51 | 0.51% | 124 | 1.24% | 2 | 0.02% | 6 | 0.06% | -1,339 | -13.35% | 10,028 |
Huntingdon | 5,232 | 67.74% | 1,784 | 23.10% | 64 | 0.83% | 199 | 2.58% | 441 | 5.71% | 4 | 0.05% | 3,448 | 44.64% | 7,724 |
Indiana | 8,616 | 71.84% | 1,936 | 16.14% | 354 | 2.95% | 947 | 7.90% | 131 | 1.09% | 9 | 0.08% | 6,680 | 55.70% | 11,993 |
Jefferson | 7,970 | 66.69% | 3,060 | 25.61% | 386 | 3.23% | 437 | 3.66% | 83 | 0.69% | 14 | 0.12% | 4,910 | 41.09% | 11,950 |
Juniata | 2,112 | 58.21% | 1,443 | 39.77% | 13 | 0.36% | 54 | 1.49% | 6 | 0.17% | 0 | 0.00% | 669 | 18.44% | 3,628 |
Lackawanna | 40,593 | 60.55% | 24,581 | 36.67% | 971 | 1.45% | 746 | 1.11% | 125 | 0.19% | 24 | 0.04% | 16,012 | 23.88% | 67,040 |
Lancaster | 29,549 | 72.88% | 9,521 | 23.48% | 636 | 1.57% | 797 | 1.97% | 29 | 0.07% | 10 | 0.02% | 20,028 | 49.40% | 40,542 |
Lawrence | 9,448 | 64.38% | 2,720 | 18.53% | 854 | 5.82% | 1,586 | 10.81% | 50 | 0.34% | 18 | 0.12% | 6,728 | 45.84% | 14,676 |
Lebanon | 8,778 | 70.78% | 3,016 | 24.32% | 246 | 1.98% | 301 | 2.43% | 55 | 0.44% | 6 | 0.05% | 5,762 | 46.46% | 12,402 |
Lehigh | 18,032 | 59.49% | 10,863 | 35.84% | 829 | 2.74% | 262 | 0.86% | 311 | 1.03% | 13 | 0.04% | 7,169 | 23.65% | 30,310 |
Luzerne | 49,419 | 65.39% | 23,473 | 31.06% | 1,891 | 2.50% | 555 | 0.73% | 190 | 0.25% | 47 | 0.06% | 25,946 | 34.33% | 75,575 |
Lycoming | 10,570 | 56.72% | 5,853 | 31.41% | 695 | 3.73% | 1,470 | 7.89% | 34 | 0.18% | 13 | 0.07% | 4,717 | 25.31% | 18,635 |
McKean | 7,830 | 68.65% | 2,505 | 21.96% | 328 | 2.88% | 699 | 6.13% | 36 | 0.32% | 8 | 0.07% | 5,325 | 46.69% | 11,406 |
Mercer | 11,575 | 60.29% | 4,823 | 25.12% | 1,009 | 5.26% | 1,677 | 8.73% | 102 | 0.53% | 13 | 0.07% | 6,752 | 35.17% | 19,199 |
Mifflin | 3,872 | 58.93% | 2,400 | 36.52% | 156 | 2.37% | 124 | 1.89% | 15 | 0.23% | 4 | 0.06% | 1,472 | 22.40% | 6,571 |
Monroe | 3,278 | 48.01% | 3,396 | 49.74% | 33 | 0.48% | 114 | 1.67% | 3 | 0.04% | 4 | 0.06% | -118 | -1.73% | 6,828 |
Montgomery | 31,963 | 69.70% | 12,239 | 26.69% | 1,180 | 2.57% | 303 | 0.66% | 106 | 0.23% | 64 | 0.14% | 19,724 | 43.01% | 45,855 |
Montour | 2,296 | 53.76% | 1,872 | 43.83% | 21 | 0.49% | 77 | 1.80% | 5 | 0.12% | 0 | 0.00% | 424 | 9.93% | 4,271 |
Northampton | 14,227 | 58.78% | 9,086 | 37.54% | 508 | 2.10% | 299 | 1.24% | 71 | 0.29% | 13 | 0.05% | 5,141 | 21.24% | 24,204 |
Northumberland | 17,288 | 58.44% | 9,854 | 33.31% | 1,797 | 6.07% | 590 | 1.99% | 37 | 0.13% | 15 | 0.05% | 7,434 | 25.13% | 29,581 |
Perry | 3,787 | 60.64% | 2,314 | 37.05% | 20 | 0.32% | 86 | 1.38% | 28 | 0.45% | 10 | 0.16% | 1,473 | 23.59% | 6,245 |
Philadelphia | 307,826 | 73.43% | 90,151 | 21.50% | 17,845 | 4.26% | 1,831 | 0.44% | 1,207 | 0.29% | 352 | 0.08% | 217,675 | 51.92% | 419,212 |
Pike | 1,319 | 58.05% | 880 | 38.73% | 36 | 1.58% | 31 | 1.36% | 6 | 0.26% | 0 | 0.00% | 439 | 19.32% | 2,272 |
Potter | 4,036 | 70.19% | 1,106 | 19.23% | 251 | 4.37% | 342 | 5.95% | 12 | 0.21% | 3 | 0.05% | 2,930 | 50.96% | 5,750 |
Schuylkill | 30,259 | 59.46% | 18,746 | 36.84% | 1,313 | 2.58% | 356 | 0.70% | 168 | 0.33% | 45 | 0.09% | 11,513 | 22.62% | 50,887 |
Snyder | 2,751 | 72.20% | 964 | 25.30% | 56 | 1.47% | 34 | 0.89% | 4 | 0.10% | 1 | 0.03% | 1,787 | 46.90% | 3,810 |
Somerset | 12,436 | 75.81% | 2,912 | 17.75% | 490 | 2.99% | 492 | 3.00% | 67 | 0.41% | 7 | 0.04% | 9,524 | 58.06% | 16,404 |
Sullivan | 1,620 | 57.57% | 1,061 | 37.70% | 10 | 0.36% | 122 | 4.34% | 1 | 0.04% | 0 | 0.00% | 559 | 19.86% | 2,814 |
Susquehanna | 6,572 | 66.41% | 2,905 | 29.36% | 80 | 0.81% | 320 | 3.23% | 15 | 0.15% | 4 | 0.04% | 3,667 | 37.06% | 9,896 |
Tioga | 9,718 | 83.28% | 1,258 | 10.78% | 60 | 0.51% | 613 | 5.25% | 11 | 0.09% | 9 | 0.08% | 8,460 | 72.50% | 11,669 |
Union | 3,305 | 71.38% | 1,155 | 24.95% | 38 | 0.82% | 128 | 2.76% | 2 | 0.04% | 2 | 0.04% | 2,150 | 46.44% | 4,630 |
Venango | 7,718 | 65.71% | 2,669 | 22.72% | 283 | 2.41% | 1,032 | 8.79% | 38 | 0.32% | 6 | 0.05% | 5,049 | 42.98% | 11,746 |
Warren | 7,791 | 65.07% | 2,180 | 18.21% | 312 | 2.61% | 1,669 | 13.94% | 10 | 0.08% | 12 | 0.10% | 5,611 | 46.86% | 11,974 |
Washington | 18,514 | 62.49% | 8,827 | 29.80% | 1,157 | 3.91% | 836 | 2.82% | 268 | 0.90% | 23 | 0.08% | 9,687 | 32.70% | 29,625 |
Wayne | 5,164 | 73.14% | 1,589 | 22.51% | 69 | 0.98% | 229 | 3.24% | 6 | 0.08% | 3 | 0.04% | 3,575 | 50.64% | 7,060 |
Westmoreland | 27,077 | 59.71% | 12,845 | 28.32% | 3,338 | 7.36% | 1,866 | 4.11% | 166 | 0.37% | 57 | 0.13% | 14,232 | 31.38% | 45,349 |
Wyoming | 3,208 | 68.43% | 1,247 | 26.60% | 25 | 0.53% | 200 | 4.27% | 4 | 0.09% | 4 | 0.09% | 1,961 | 41.83% | 4,688 |
York | 19,879 | 55.72% | 14,396 | 40.35% | 603 | 1.69% | 754 | 2.11% | 27 | 0.08% | 20 | 0.06% | 5,483 | 15.37% | 35,679 |
| Totals | 1,218,216 | 65.76% | 503,843 | 27.20% | 70,571 | 3.81% | 42,696 | 2.30% | 15,704 | 0.85% | 1,586 | 0.09% | 714,373 | 38.56% | 1,852,616 |
References[edit]
^ "1920 Presidential General Election Results – Pennsylvania". Dave Leip’s U.S. Election Atlas. Retrieved 2018-03-17..mw-parser-output cite.citationfont-style:inherit.mw-parser-output .citation qquotes:"""""""'""'".mw-parser-output .citation .cs1-lock-free abackground:url("//upload.wikimedia.org/wikipedia/commons/thumb/6/65/Lock-green.svg/9px-Lock-green.svg.png")no-repeat;background-position:right .1em center.mw-parser-output .citation .cs1-lock-limited a,.mw-parser-output .citation .cs1-lock-registration abackground:url("//upload.wikimedia.org/wikipedia/commons/thumb/d/d6/Lock-gray-alt-2.svg/9px-Lock-gray-alt-2.svg.png")no-repeat;background-position:right .1em center.mw-parser-output .citation .cs1-lock-subscription abackground:url("//upload.wikimedia.org/wikipedia/commons/thumb/a/aa/Lock-red-alt-2.svg/9px-Lock-red-alt-2.svg.png")no-repeat;background-position:right .1em center.mw-parser-output .cs1-subscription,.mw-parser-output .cs1-registrationcolor:#555.mw-parser-output .cs1-subscription span,.mw-parser-output .cs1-registration spanborder-bottom:1px dotted;cursor:help.mw-parser-output .cs1-ws-icon abackground:url("//upload.wikimedia.org/wikipedia/commons/thumb/4/4c/Wikisource-logo.svg/12px-Wikisource-logo.svg.png")no-repeat;background-position:right .1em center.mw-parser-output code.cs1-codecolor:inherit;background:inherit;border:inherit;padding:inherit.mw-parser-output .cs1-hidden-errordisplay:none;font-size:100%.mw-parser-output .cs1-visible-errorfont-size:100%.mw-parser-output .cs1-maintdisplay:none;color:#33aa33;margin-left:0.3em.mw-parser-output .cs1-subscription,.mw-parser-output .cs1-registration,.mw-parser-output .cs1-formatfont-size:95%.mw-parser-output .cs1-kern-left,.mw-parser-output .cs1-kern-wl-leftpadding-left:0.2em.mw-parser-output .cs1-kern-right,.mw-parser-output .cs1-kern-wl-rightpadding-right:0.2em
^ Pennsylvania Bureau of Publications, comp., ‘Official Vote of Pennsylvania for Presidential Electors, November 2, 1920,’ Smull’s Legislative Hand Book and Manual of the State of Pennsylvania 1921-22 (Harrisburg: J. L. L. Kuhn, 1922)
Categories:
- 1920 United States presidential election by state
- United States presidential elections in Pennsylvania
- 1920 Pennsylvania elections
(window.RLQ=window.RLQ||).push(function()mw.config.set("wgPageParseReport":"limitreport":"cputime":"0.712","walltime":"0.912","ppvisitednodes":"value":7381,"limit":1000000,"ppgeneratednodes":"value":0,"limit":1500000,"postexpandincludesize":"value":280233,"limit":2097152,"templateargumentsize":"value":5488,"limit":2097152,"expansiondepth":"value":15,"limit":40,"expensivefunctioncount":"value":6,"limit":500,"unstrip-depth":"value":1,"limit":20,"unstrip-size":"value":3551,"limit":5000000,"entityaccesscount":"value":0,"limit":400,"timingprofile":["100.00% 494.761 1 -total"," 42.17% 208.626 1 Template:Infobox_Election"," 31.16% 154.171 1 Template:Infobox"," 17.07% 84.432 1 Template:Reflist"," 15.73% 77.813 3 Template:Infobox_election/row"," 15.59% 77.112 1 Template:Cite_web"," 9.40% 46.484 1 Template:ElectionsPA"," 7.61% 37.674 1 Template:Sidebar_with_collapsible_lists"," 6.18% 30.575 1 Template:Main"," 4.04% 20.007 8 Template:Sidebar"],"scribunto":"limitreport-timeusage":"value":"0.124","limit":"10.000","limitreport-memusage":"value":3091125,"limit":52428800,"cachereport":"origin":"mw1264","timestamp":"20190329023950","ttl":2592000,"transientcontent":false);mw.config.set("wgBackendResponseTime":131,"wgHostname":"mw1246"););


